Shrinkage Implementations

An Introduction to Statistical Learning with Applications in Python by Gareth James, Daniela Witten, Trevor Hastie and Robert Tibshirani

Author

Sungkyun Cho

Published

November 28, 2024

Load packages
# numerical calculation & data frames
import numpy as np
import pandas as pd

# visualization
import matplotlib.pyplot as plt
import seaborn as sns
import seaborn.objects as so

# statistics
import statsmodels.api as sm

# pandas options
pd.set_option('mode.copy_on_write', True)  # pandas 2.0
pd.options.display.max_rows = 7  # max number of rows to display

# NumPy options
np.set_printoptions(precision = 5, suppress=True)  # suppress scientific notation

# For high resolution display
import matplotlib_inline
matplotlib_inline.backend_inline.set_matplotlib_formats("retina")
from ISLP import load_data
from ISLP.models import ModelSpec

import sklearn.model_selection as skm
import sklearn.linear_model as sklm
from sklearn.preprocessing import StandardScaler
from sklearn.pipeline import Pipeline
from sklearn.metrics import root_mean_squared_error, r2_score

Major League Baseball Data from the 1986 and 1987 seasons

Hitters = load_data('Hitters') # from ISLP
Hitters = Hitters.dropna()
Hitters
     AtBat  Hits  HmRun  Runs  RBI  Walks  Years  CAtBat  CHits  CHmRun  \
1      315    81      7    24   38     39     14    3449    835      69   
2      479   130     18    66   72     76      3    1624    457      63   
3      496   141     20    65   78     37     11    5628   1575     225   
..     ...   ...    ...   ...  ...    ...    ...     ...    ...     ...   
319    475   126      3    61   43     52      6    1700    433       7   
320    573   144      9    85   60     78      8    3198    857      97   
321    631   170      9    77   44     31     11    4908   1457      30   

     CRuns  CRBI  CWalks League Division  PutOuts  Assists  Errors  Salary  \
1      321   414     375      N        W      632       43      10   475.0   
2      224   266     263      A        W      880       82      14   480.0   
3      828   838     354      N        E      200       11       3   500.0   
..     ...   ...     ...    ...      ...      ...      ...     ...     ...   
319    217    93     146      A        W       37      113       7   385.0   
320    470   420     332      A        E     1314      131      12   960.0   
321    775   357     249      A        W      408        4       3  1000.0   

    NewLeague  
1           N  
2           A  
3           N  
..        ...  
319         A  
320         A  
321         A  

[263 rows x 20 columns]

Predicting Baseball Salaries

선수들의 여러 지표를 바탕으로 선수의 연봉을 예측하고자 함.

# specifiy the predictors and response
X = Hitters.drop(columns='Salary')
X = pd.get_dummies(X, drop_first=True)  # convert categorical variables to dummy variables
y = Hitters['Salary']
X
     AtBat  Hits  HmRun  Runs  RBI  Walks  Years  CAtBat  CHits  CHmRun  \
1      315    81      7    24   38     39     14    3449    835      69   
2      479   130     18    66   72     76      3    1624    457      63   
3      496   141     20    65   78     37     11    5628   1575     225   
..     ...   ...    ...   ...  ...    ...    ...     ...    ...     ...   
319    475   126      3    61   43     52      6    1700    433       7   
320    573   144      9    85   60     78      8    3198    857      97   
321    631   170      9    77   44     31     11    4908   1457      30   

     CRuns  CRBI  CWalks  PutOuts  Assists  Errors  League_N  Division_W  \
1      321   414     375      632       43      10      True        True   
2      224   266     263      880       82      14     False        True   
3      828   838     354      200       11       3      True       False   
..     ...   ...     ...      ...      ...     ...       ...         ...   
319    217    93     146       37      113       7     False        True   
320    470   420     332     1314      131      12     False       False   
321    775   357     249      408        4       3     False        True   

     NewLeague_N  
1           True  
2          False  
3           True  
..           ...  
319        False  
320        False  
321        False  

[263 rows x 19 columns]

ISLP 패키지의 ModelSpec()을 이용해 예측변수 중 카테고리 변수에 대한 preprocessing

MS = ModelSpec(Hitters.columns.drop(['Salary']), intercept=False)
X = MS.fit_transform(Hitters)

padas의 pd.get_dummies()를 사용

X = Hitters.drop(columns='Salary')
X = pd.get_dummies(X, drop_first=True)

sklearn의 OneHotEncoder를 사용하면,

from sklearn.preprocessing import OneHotEncoder
from sklearn.compose import ColumnTransformer

X = Hitters.drop(columns='Salary')
X_cat = X.select_dtypes('category').columns.tolist()
X_num = X.select_dtypes('number').columns.tolist()

enc = OneHotEncoder(sparse_output=False, drop="first")
ct = ColumnTransformer([('onehot', enc, X_cat)], remainder='passthrough')

X = ct.fit_transform(X)

Ridge Regression

import sklearn.linear_model as sklm
from sklearn.preprocessing import StandardScaler

# standardize X
scaler = StandardScaler()
X_scaled = scaler.fit_transform(X)

# create an array of alpha values
lambdas = np.logspace(-2, 10, 100) / y.std()  

ridge_coefs = []
for alpha in lambdas:
    ridge = sklm.Ridge(alpha=alpha)
    ridge.fit(X_scaled, y)
    ridge_coefs.append(ridge.coef_)
ridge_coefs = np.array(ridge_coefs)
ridge_coefs = pd.DataFrame(ridge_coefs, columns=X.columns, index=lambdas)
ridge_coefs.index.name = 'lambda'
ridge_coefs.head(3)
               AtBat        Hits      HmRun       Runs        RBI       Walks  \
lambda                                                                          
0.000022 -291.094162  337.829131  37.853033 -60.571234 -26.994245  135.073570   
0.000029 -291.094036  337.828697  37.852775 -60.570833 -26.994007  135.073465   
0.000039 -291.093868  337.828124  37.852433 -60.570303 -26.993693  135.073326   

              Years      CAtBat      CHits     CHmRun       CRuns        CRBI  \
lambda                                                                          
0.000022 -16.694157 -391.033663  86.691953 -14.178832  480.740064  260.684702   
0.000029 -16.694414 -391.032055  86.693349 -14.177901  480.737788  260.683034   
0.000039 -16.694753 -391.029931  86.695195 -14.176671  480.734779  260.680828   

              CWalks    PutOuts    Assists     Errors   League_N  Division_W  \
lambda                                                                         
0.000022 -213.891103  78.761297  53.732322 -22.160934  31.248776  -58.414130   
0.000029 -213.890731  78.761297  53.732268 -22.160957  31.248781  -58.414151   
0.000039 -213.890240  78.761297  53.732197 -22.160987  31.248787  -58.414180   

          NewLeague_N  
lambda                 
0.000022   -12.348893  
0.000029   -12.348919  
0.000039   -12.348954  
ridge_coefs.plot(figsize=(8, 6))
plt.xlabel('$\lambda$')
plt.ylabel('Standardized coefficients')
plt.xscale('log')
plt.legend(loc='center left', bbox_to_anchor=(1, 0.5))
plt.show()

\(\lambda\)값 중 하나를 살펴보면, 가령 50번째 \(\lambda\)값과 그에 대응하는 회귀계수들은

pd.options.display.max_rows = 0
beta_hat = ridge_coefs.iloc[50, :]
print(f"lambda: {lambdas[50]}, \nbeta hats: \n{beta_hat}")
lambda: 25.48679637046264, 
beta hats: 
AtBat         -60.554231
Hits           94.445543
HmRun         -11.652839
Runs           29.082098
RBI            20.558595
Walks          61.290878
Years         -32.326762
CAtBat         11.255280
CHits          72.074056
CHmRun         52.153738
CRuns          76.011242
CRBI           73.044427
CWalks        -45.183088
PutOuts        70.812650
Assists        18.834114
Errors        -22.285540
League_N       23.712255
Division_W    -59.725489
NewLeague_N    -5.619252
Name: 25.48679637046264, dtype: float64

Estimating Test Error of Ridge Regression

한 예로, \(\lambda = 25\)로 Ridge regression을 수행하면,

from sklearn.pipeline import Pipeline

ridge = sklm.Ridge(alpha=25)
scaler = StandardScaler()  # standardize

ridge_scaled = Pipeline([('scaler', scaler), ('ridge', ridge)])  
ridge_scaled.fit(X, y)
Pipeline(steps=[('scaler', StandardScaler()), ('ridge', Ridge(alpha=25))])
In a Jupyter environment, please rerun this cell to show the HTML representation or trust the notebook.
On GitHub, the HTML representation is unable to render, please try loading this page with nbviewer.org.
Using Pipeline

파이프라인을 사용해, scikit-learn의 여러 class들을(예. estimator, tranformer) 순서대로 적용되도록 묶을 수 있음
Tuple의 list로 입력: (name, estimator)

ridge_scaled = Pipeline([('scaler', scaler), ('ridge', ridge)])  
ridge_scaled.fit(X, y)

이름을 지정하지 않고 간략히 처리하는 경우, Pipeline 대신 make_pipeline을 사용할 수 있음
이 경우, 이름은 자동으로 생성됨

from sklearn.pipeline import make_pipeline

ridge_scaled = make_pipeline(scaler, ridge)
ridge_scaled.fit(X, y)

각 변수의 파라미터 추정치

ridge.coef_
array([-61.83616,  95.40164, -11.71174,  29.01527,  20.50437,  61.68053,
       -32.74913,  10.86313,  72.57968,  52.3169 ,  76.67548,  73.45853,
       -46.12262,  70.93771,  19.03332, -22.37589,  23.82647, -59.80705,
        -5.75064])

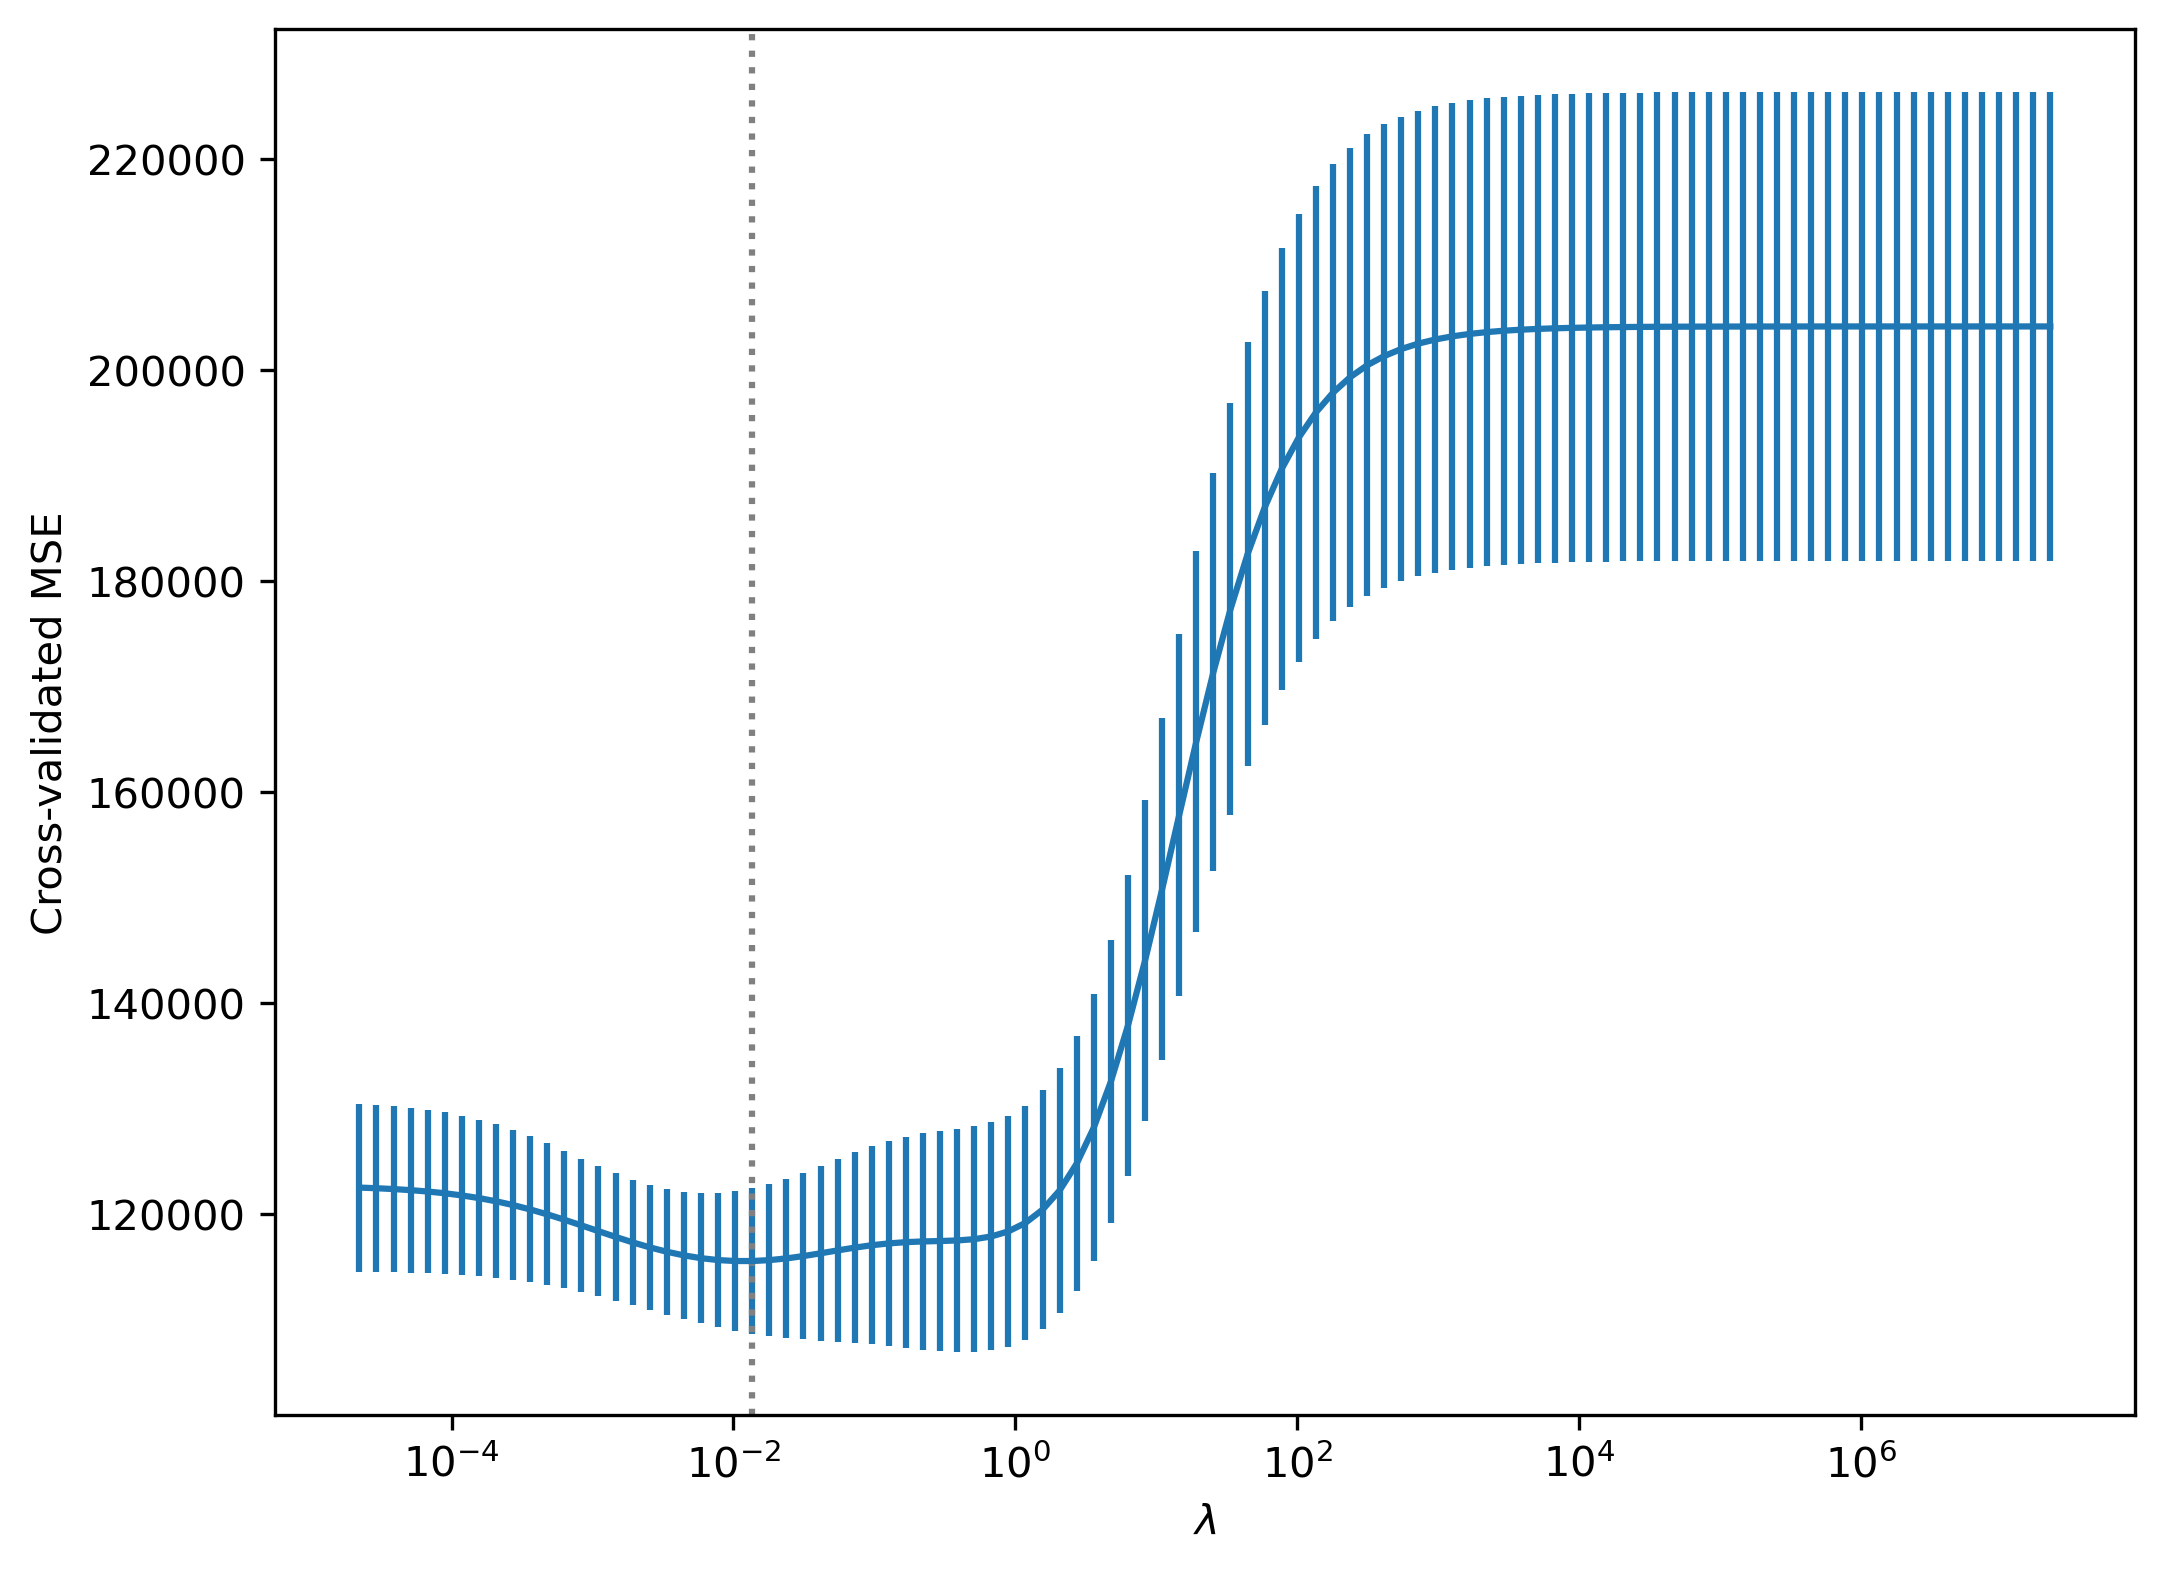
이제, 최적의 \(\lambda\)를 찾기 위해 cross-validation을 수행하는데,
기준이 되는 대표적 metric은 MSE(mean squared error) 또는 \(R^2\)

다른 metric에 대해서는 sklearn.metric 참고

import sklearn.model_selection as skm

ridge = sklm.Ridge()
scaler = StandardScaler()
ridge_scaled = Pipeline([('scaler', scaler), ('ridge', ridge)])  

K = 5
kfold = skm.KFold(K, shuffle=True, random_state=0)
param_grid = {'ridge__alpha': lambdas}  # ridge: the name of the step in the pipeline, alpha: the parameter name

grid = skm.GridSearchCV(ridge_scaled, 
                        param_grid,
                        cv=kfold,
                        scoring='neg_mean_squared_error')
grid.fit(X, y)
GridSearchCV(cv=KFold(n_splits=5, random_state=0, shuffle=True),
             estimator=Pipeline(steps=[('scaler', StandardScaler()),
                                       ('ridge', Ridge())]),
             param_grid={'ridge__alpha': array([       0.00002,        0.00003,        0.00004,        0.00005,
              0.00007,        0.00009,        0.00012,        0.00016,
              0.00021,        0.00027,        0.00036,        0.00048,
              0.00063,        0.00083,        0.0011 ,        0.00146,
              0.00193,        0.00255,        0.00337,        0.00445,
              0.00589,        0.00778,        0.010...
          36126.87535,    47757.60309,    63132.74068,    83457.76772,
         110326.25731,   145844.81929,   192798.26791,   254867.9637 ,
         336920.44865,   445389.00483,   588778.05255,   778329.93498,
        1028906.36814,  1360153.66596,  1798043.09927,  2376907.15964,
        3142131.38041,  4153712.76566,  5490963.82383,  7258731.02346,
        9595615.22556, 12684838.61151, 16768610.12221, 22167115.72313])},
             scoring='neg_mean_squared_error')
In a Jupyter environment, please rerun this cell to show the HTML representation or trust the notebook.
On GitHub, the HTML representation is unable to render, please try loading this page with nbviewer.org.
grid.best_params_
{'ridge__alpha': np.float64(2.732865634209876)}
grid.best_estimator_
Pipeline(steps=[('scaler', StandardScaler()),
                ('ridge', Ridge(alpha=np.float64(2.732865634209876)))])
In a Jupyter environment, please rerun this cell to show the HTML representation or trust the notebook.
On GitHub, the HTML representation is unable to render, please try loading this page with nbviewer.org.
grid.best_estimator_.fit(X, y).named_steps['ridge'].coef_
array([-230.65706,  247.37135,    5.00202,   -6.18649,    2.11026,
        111.2861 ,  -49.87498, -118.09574,  123.57104,   56.01087,
        222.83363,  121.82137, -155.27562,   77.90012,   41.12019,
        -24.88459,   30.4831 ,  -61.48008,  -13.76634])
plt.figure(figsize=(8, 6), dpi=70)
plt.errorbar(
    lambdas,
    -grid.cv_results_["mean_test_score"],
    yerr=grid.cv_results_["std_test_score"] / np.sqrt(K),
)
plt.axvline(grid.best_params_["ridge__alpha"], color=".5", linestyle=":")
plt.xlabel("$\lambda$")
plt.ylabel("Cross-validated MSE")
plt.xscale("log")
plt.show()

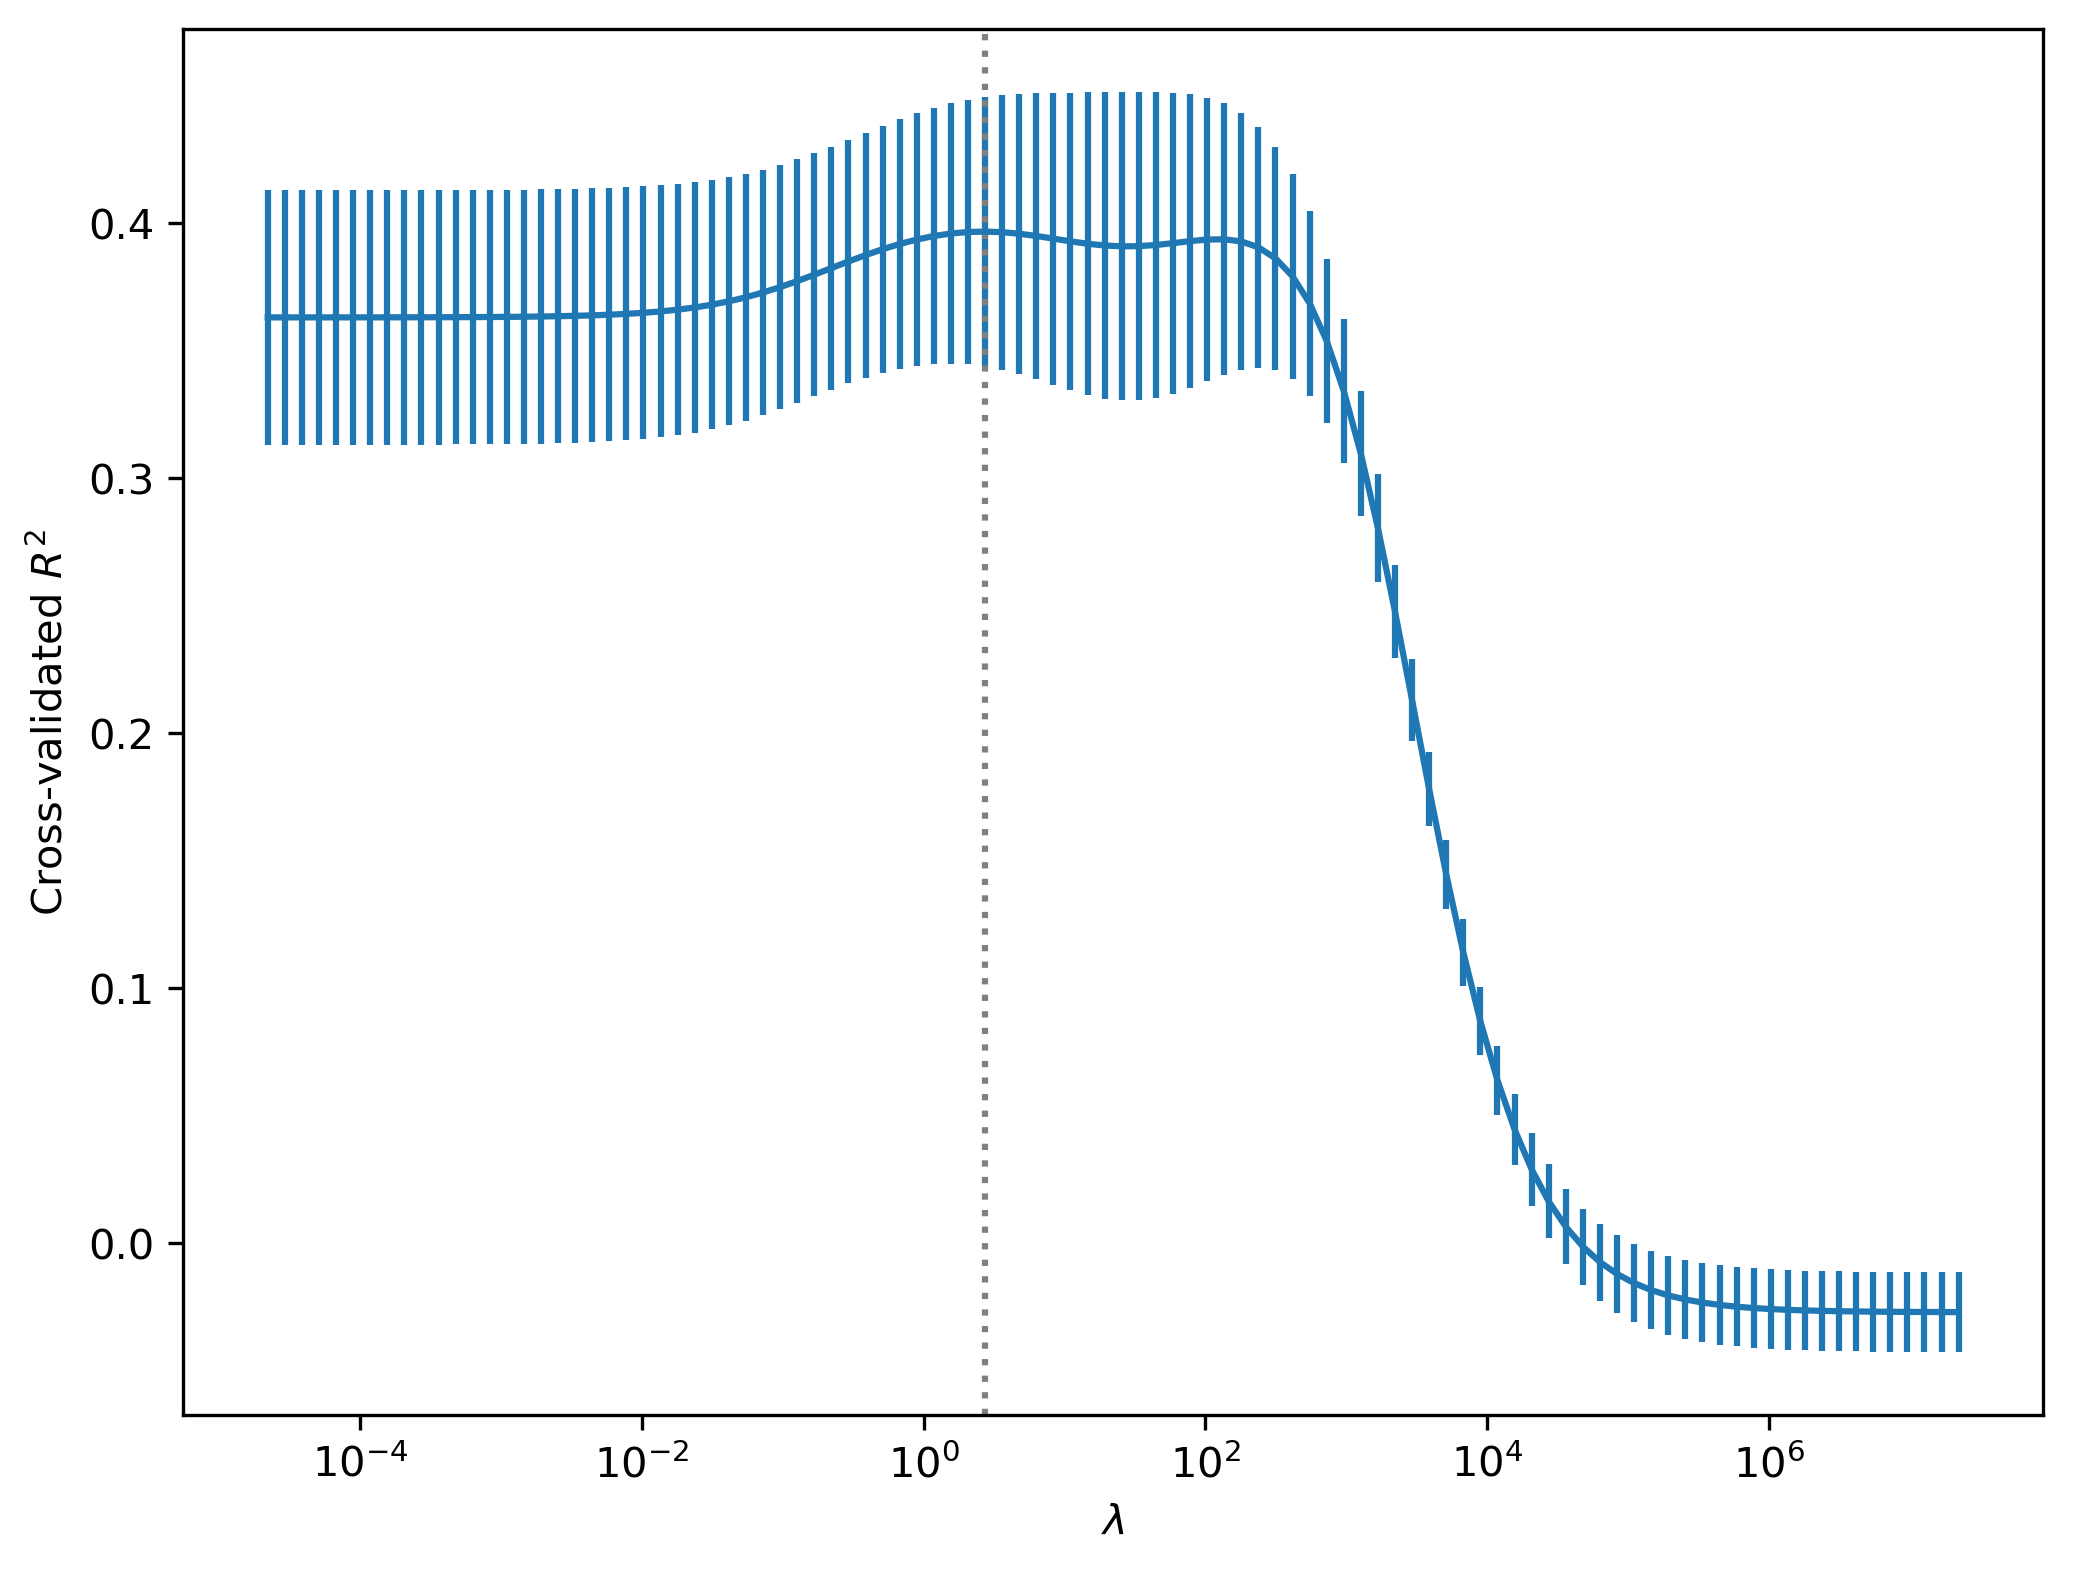
R-squared 값으로 비교하면, (default 값)

grid = skm.GridSearchCV(ridge_scaled, 
                        param_grid,
                        cv=kfold,
                        scoring='r2') # default
grid.fit(X, y)

위와 마찬가지로 plot을 그리면,

Tip

Cross-validation이 통합되어 있는 간편한 함수: RidgeCV, LassoCV, ElasticNetCV

# suppress warnings for ElasticNet
import warnings
warnings.filterwarnings('ignore')
kfold = skm.KFold(5, shuffle=True, random_state=0)

# RidgeCV 함수에 mse_path가 없으므로, 대신 ElasticNetCV를 사용
ridgeCV = sklm.ElasticNetCV(alphas=lambdas, l1_ratio=0, cv=kfold)  # l1_ratio=0: L2 regularization, l1_ratio=1: L1 regularization
pipeCV = Pipeline(steps=[("scaler", scaler), ("ridge", ridgeCV)])
pipeCV.fit(X, y)
ridgeCV.alpha_
np.float64(0.01360153665961598)
ridgeCV.coef_
array([-213.94939,  229.32917,    1.36088,    0.44074,    5.24782,
        106.26368,  -51.59113,  -92.22839,  120.087  ,   58.1399 ,
        197.63691,  114.42331, -144.621  ,   77.54784,   38.9252 ,
        -25.15106,   30.2249 ,  -61.76237,  -13.56158])
\(\lambda\)에 따른 변화를 보려면
tuned_ridge = pipeCV.named_steps["ridge"]

plt.figure(figsize=(8, 6), dpi=40)
plt.errorbar(
    lambdas[::-1],
    tuned_ridge.mse_path_.mean(axis=1),
    yerr=tuned_ridge.mse_path_.std(axis=1) / np.sqrt(K),
)
plt.axvline(tuned_ridge.alpha_, c=".5", ls=":")
plt.xlabel("$\lambda$")
plt.ylabel("Cross-validated MSE")
plt.xscale("log")
plt.show()

Evaluating Test Error of Cross-Validated Ridge

앞서 적절한 \(\lambda\)를 찾기 위해 cross-validation을 활용하는 방법을 살펴보았음.
타당한 “test” error를 구하기 위해서는 처음에 training set만을 이용해 \(\lambda\)를 찾은 후,
test set을 이용해 error를 구해야 함.

# Split the data into training and test sets
X_train, X_test, y_train, y_test = skm.train_test_split(X, y, test_size=0.5, random_state=123)

# standardize X
scaler = StandardScaler()
X_train_scaled = scaler.fit_transform(X_train)
X_test_scaled = scaler.transform(X_test)

# Fit the model on the training set
kfold = skm.KFold(n_splits=5, shuffle=True, random_state=2)
ridgeCV = sklm.RidgeCV(alphas=lambdas, cv=kfold)

ridgeCV.fit(X_train_scaled, y_train)
RidgeCV(alphas=array([275.03283, 256.49654, 239.20953, 223.08761, 208.05225, 194.03023,
       180.95324, 168.7576 , 157.3839 , 146.77675, 136.88449, 127.65893,
       119.05515, 111.03123, 103.5481 ,  96.5693 ,  90.06085,  83.99105,
        78.33034,  73.05113,  68.12773,  63.53615,  59.25403,  55.2605 ,
        51.53613,  48.06277,  44.8235 ,  41.80255,  38.98519,  36.35772,
        33.90733,  31.62209,  29.49087,  27.50328,  25.64965,  23.9...
         4.18025,   3.89852,   3.63577,   3.39073,   3.16221,   2.94909,
         2.75033,   2.56497,   2.3921 ,   2.23088,   2.08052,   1.9403 ,
         1.80953,   1.68758,   1.57384,   1.46777,   1.36884,   1.27659,
         1.19055,   1.11031,   1.03548,   0.96569,   0.90061,   0.83991,
         0.7833 ,   0.73051,   0.68128,   0.63536,   0.59254,   0.55261,
         0.51536,   0.48063,   0.44823,   0.41803,   0.38985,   0.36358,
         0.33907,   0.31622,   0.29491,   0.27503]),
        cv=KFold(n_splits=5, random_state=2, shuffle=True))
In a Jupyter environment, please rerun this cell to show the HTML representation or trust the notebook.
On GitHub, the HTML representation is unable to render, please try loading this page with nbviewer.org.
from sklearn.metrics import root_mean_squared_error, r2_score

# Calculate the test RMSE and R-squared using the test set
def print_metrics(y, x):
    print(f"Test RMSE = {root_mean_squared_error(y, x):.2f}")
    print(f"Test R-squared = {r2_score(y, x):.2f}")

print_metrics(y_test, ridgeCV.predict(X_test_scaled))
Test RMSE = 330.19
Test R-squared = 0.34

ShuffleSplit으로 1번 교차검증을 하는 방식으로, training set과 test set을 나누는 방법

outer_valid = skm.ShuffleSplit(n_splits=1, test_size=0.25, random_state=1)

inner_cv = skm.KFold(n_splits=5, shuffle=True, random_state=2)
ridgeCV = sklm.RidgeCV(alphas=lambdas, cv=inner_cv)
pipeCV = Pipeline(steps=[("scaler", scaler), ("ridge", ridgeCV)])

results = skm.cross_validate(
    pipeCV, X, y, cv=outer_valid, scoring="neg_mean_squared_error"
)

-results["test_score"]
# array([132026.01644])

Higer order polynomial regression + Ridge

고차항을 추가한 후 Ridge regression을 수행하면,

from sklearn.preprocessing import PolynomialFeatures

ridge = sklm.Ridge()
poly = PolynomialFeatures(degree=2)  # 모든 2차항을 포함
poly_ridge = Pipeline([('poly', poly), ('ridge', ridge)])

K = 5
kfold = skm.KFold(K, shuffle=True, random_state=0)
lambdas = np.logspace(-2, 10, 100) / y.std()
param_grid = {'ridge__alpha': lambdas}

grid_poly_ridge = skm.GridSearchCV(poly_ridge, 
                        param_grid,
                        cv=kfold,
                        scoring='neg_mean_squared_error')
grid_poly_ridge.fit(X_train_scaled, y_train);
print_metrics(y_test, grid_poly_ridge.best_estimator_.predict(X_test_scaled))
Test RMSE = 360.57
Test R-squared = 0.21

Lasso Regression

Ridge에서와 마찬가지로, 우선 training/test set으로 나눈 후,
training set에서 cross-validation을 이용해 최적의 \(\lambda\)를 찾은 후,
test set을 이용해 test error를 구해보면,

# Split the data into training and test sets
X_train, X_test, y_train, y_test = skm.train_test_split(X, y, test_size=0.5, random_state=1)

# standardize X
scaler = StandardScaler()
X_train_scaled = scaler.fit_transform(X_train)
X_test_scaled = scaler.transform(X_test)

# create an array of alpha values
lambdas = np.logspace(2, 6, 100) / y.std()

lasso_coefs = []
for alpha in lambdas:
    lasso = sklm.Lasso(alpha=alpha)
    lasso.fit(X_train_scaled, y_train)
    lasso_coefs.append(lasso.coef_)
lasso_coefs = np.array(lasso_coefs)
lasso_coefs = pd.DataFrame(lasso_coefs, columns=X.columns, index=lambdas)
lasso_coefs.index.name = 'lambda'
lasso_coefs.sample(5)
                 AtBat        Hits      HmRun  Runs        RBI      Walks  \
lambda                                                                      
58.877805     0.000000   28.063740   0.000000   0.0  15.507350  54.777702   
3.964920   -282.087576  298.363238 -25.946751  -0.0  43.706836  87.276887   
344.848531    0.000000    0.000000   0.000000   0.0   0.000000   0.000000   
85.421614     0.000000   14.620521   0.000000   0.0  22.543629  43.842263   
14.584482    -0.000000   55.000151  -0.000000   0.0   0.000000  71.600000   

               Years  CAtBat  CHits     CHmRun     CRuns        CRBI   CWalks  \
lambda                                                                          
58.877805   0.000000     0.0    0.0   0.000000  0.000000  171.424457  0.00000   
3.964920   -1.315728    -0.0    0.0  94.297054  1.854077  136.835250 -5.38028   
344.848531  0.000000     0.0    0.0   0.000000  0.000000    0.000000  0.00000   
85.421614   0.000000     0.0    0.0   0.000000  0.000000  150.116450  0.00000   
14.584482   0.000000     0.0    0.0  25.159039  0.000000  185.973787  0.00000   

               PutOuts    Assists  Errors   League_N  Division_W  NewLeague_N  
lambda                                                                         
58.877805    94.315200   0.000000     0.0   0.000000  -13.044781          0.0  
3.964920    124.505182  13.670514    -0.0  15.677443  -59.922602         -0.0  
344.848531    0.000000  -0.000000     0.0  -0.000000   -0.000000         -0.0  
85.421614    79.406766   0.000000     0.0   0.000000   -0.000000          0.0  
14.584482   116.481406  -0.000000    -0.0   0.940461  -57.024540          0.0  
Plot the lasso coefficients
lasso_coefs.plot(figsize=(8, 6))
plt.xlabel('$\lambda$')
plt.ylabel('Standardized coefficients')
plt.xscale('log')
plt.legend(loc='center left', bbox_to_anchor=(1, 0.5))
plt.show()

Evaluating Test Error of Cross-Validated Ridge

5-fold cross-validation을 이용해 최적의 \(\lambda\)를 찾으면,

# Fit the model on the training set
K = 5
kfold = skm.KFold(n_splits=K, shuffle=True, random_state=1)
lassoCV = sklm.LassoCV(cv=kfold)
lassoCV.fit(X_train_scaled, y_train)
LassoCV(cv=KFold(n_splits=5, random_state=1, shuffle=True))
In a Jupyter environment, please rerun this cell to show the HTML representation or trust the notebook.
On GitHub, the HTML representation is unable to render, please try loading this page with nbviewer.org.
lassoCV.alpha_
np.float64(0.6353615151306538)
lassoCV.coef_
array([-297.37844,  254.07362,  -32.11397,  -13.73482,   85.00807,
         89.97288,   17.75389, -969.62686,  857.24631,  154.46851,
        179.9078 ,    0.     ,   -1.71849,  125.64956,   55.05843,
        -28.67818,   53.39268,  -57.39778,  -30.45363])

Test error with optimal \(\lambda\)

# Calculate the test RMSE and R-squared using the test set
print_metrics(y_test, lassoCV.predict(X_test_scaled))
Test RMSE = 328.84
Test R-squared = 0.37
Plot the cross-validated RMSE
lambdas = lassoCV.alphas_
lasso_path = np.sqrt(lassoCV.mse_path_).mean(axis=1)
lasso_path_se = np.sqrt(lassoCV.mse_path_).std(axis=1) / np.sqrt(K)

plt.figure(figsize=(8, 6), dpi=70)
plt.errorbar(lambdas, lasso_path, yerr=lasso_path_se)
plt.axvline(lassoCV.alpha_, color=".5", linestyle=":")
plt.xlabel("$\lambda$")
plt.ylabel("Cross-validated RMSE")
plt.xscale("log")
plt.show()

lasso_l20 = sklm.Lasso(alpha=20)
lasso_l20.fit(X_train_scaled, y_train)

coefs = lasso_l20.coef_
coefs
array([ -0.     ,  52.94574,   0.     ,   0.     ,   0.     ,  69.58717,
         0.     ,   0.     ,   0.     ,  22.35575,   0.     , 184.34984,
         0.     , 113.96798,  -0.     ,  -0.     ,   0.     , -51.76979,
         0.     ])

19개의 변수 중 다음 6개의 변수만 선택하여, 소위 variable/feature selection을 수행하게 됨.
반면, 앞서 최적의 \(\lambda=0.75\)에서는 17개의 변수가 선택되었음.

X.columns[coefs.nonzero()]
Index(['Hits', 'Walks', 'CHmRun', 'CRBI', 'PutOuts', 'Division_W'], dtype='object')

Test error with \(\lambda=20\)

print_metrics(y_test, lasso_l20.predict(X_test_scaled))
Test RMSE = 323.47
Test R-squared = 0.39
Feature selection using SelectFromModel

SelectFromModel()를 이용해, Lasso regression을 통해 선택된 변수만을 사용할 수 있음

from sklearn.feature_selection import SelectFromModel

model_reduced = SelectFromModel(lasso_l20, prefit=True)
X_new = model_reduced.transform(X)
X_new
# array([[  81,   39,   69,  414,  632,    1],
#        [ 130,   76,   63,  266,  880,    1],
#        [ 141,   37,  225,  838,  200,    0],
#        ...,
#        [ 126,   52,    7,   93,   37,    1],
#        [ 144,   78,   97,  420, 1314,    0],
#        [ 170,   31,   30,  357,  408,    1]])

Comparisons

모두 함께 비교하면,

Hitters의 예는 19개의 예측변수와 N=263개의 관측값만으로 연봉을 예측하는 문제임.
그 중 50%의 training set으로 모델을 fitting한 후, 나머지 50%의 test set으로 모델을 평가함.

만약, 선형회귀모델을 사용한다면,

lr = sklm.LinearRegression()
lr.fit(X_train_scaled, y_train)
print_metrics(y_test, lr.predict(X_test_scaled))
Test RMSE = 341.60
Test R-squared = 0.32

이전 Ridge, Ridge with a higher order polynomial, Lasso, Lasso with variable selection에 대한 결과를 비교해보면,

Ridge
Test RMSE = 318.85
Test R-squared = 0.41

Ridge with polynomial of degree 2
Test RMSE = 304.79
Test R-squared = 0.46

Lasso
Test RMSE = 328.84
Test R-squared = 0.37

Lasso with 6 predictors only (lambda = 20)
Test RMSE = 323.47
Test R-squared = 0.39